
30 Years of the Wholesale Market: How Has Electricity Generation Changed?
Download ReportBy Greg Sise, 10th November, 2026
Energy Trendz Perspective - Issue 11
Our Executive Chairman, Greg Sise, looks back over 30 years of the wholesale market, in the fourth of a series of perspectives on the market.
2026 is a milestone year for the wholesale market and for Energy Link, because on 2nd September Energy Link was 30 years old and on 1st October the electricity market was also 30 years old.
This is the fourth in a series of articles that are a mix of perspectives on the market, focussing on key elements such as demand and generation, and also on Energy Link, the role that we’ve played, and how this has changed.
The first article looked at why we have a competitive market, starting with moves to reform the electricity sector in the late 1980s, through to the start of the spot market in October 1996.
The second article looked at how the market performed relative to why it was set up.
The third article looked at how demand has changed since 1996 and how it might change in the future.
This article looks at the supply-side of the wholesale market, how generation for electricity in NZ has changed over 30 years and where it might go in future.
Looking Back
The gold standard for electricity generation data is the data provided in MBIE’s Energy in New Zealand publication, issued annually. This is the total generation of electricity as measured at generators’ meters.
Total generation is greater than total demand due to losses incurred in transmitting energy from generators, wherever they are, to consumers, wherever they are. In NZ in 2025 losses were 7% of all generation, with 3.2% lost in the transmission grid and 3.8% lost in distribution (local) networks that connect consumers to the grid. Losses are caused by the physical properties of the conductors in electricity networks, and most of the losses are due to heating of these conductors.
For example, some of the generation in the lower half of the South Island typically ends up being sent across the high voltage DC (HVDC) link between the South and North Islands. This includes generation at the Benmore power station on the Waitaki River, which also happens to be at the southern end of the HVDC link, and from other power stations south and north of Benmore in the South Island. Power crosses the link and arrives at Haywards in Upper Hutt, then it might continue on the grid to Auckland, where it will head off the grid and onto the Vector network, which has consumers connected to it. This is an oversimplification of how the system works, but hopefully you get the idea.
Losses occur on the HVDC link, then on the AC grid between Haywards and Auckland, and also in the Vector network, which carries power from the transmission grid to consumers.
The first chart below shows the total generation by type since 1996, and the table below it shows the change in annual generation from 1996 to 2025. The first chart also shows the %RE (percentage of renewable energy) curve which is the percentage of generation from renewable sources. Geothermal generation is classed as renewable even though geothermal has some emissions associated with it as CO2, which is released when geothermal steam reaches the surface. Recently, however, geothermal generators have started to reinject CO2 back into their respective underground geothermal fields, which has significantly reduced the net emissions associated with this type of generation.

Geothermal is the generation type that increased the most over the period, followed by wind. Generation from fossil fuels fell by 2,007 GWh (28%) and the %RE rose from 80.1% in 1996 to 88.5% in 2025. The %RE moves around significantly year-to-year primarily due to fluctuations in the total inflows into the hydro lakes, so drier years have lower %RE, and vice versa.
There is no solar generation recorded in 1996 in the MBIE data, so a percentage increase cannot be calculated, but wind increased by a staggering 46 times on an annual basis!
Note that waste heat refers to generation using hot gases created by an industrial process.

Gas-fired thermal generation fell substantially since 1996, but coal-fired thermal generation increased. Across the combined gas, oil and coal-fired thermal generation, the reduction of 28% occurred after 2008.
In the early days of the wholesale market, three large combined-cycle gas turbine generators were built: the 170 MW Southdown combined-cycle commissioned in 1996, the 377 MW Taranaki combined-cycle (TCC) commissioned in 1998 and the 400 MW Otahuhu B combined-cycle (OTAB) commissioned in 2000/01. Up to that point, the gas-turbines in NZ were of the open cycle type, which are around 35% efficient, but the combined-cycle gas turbines achieve efficiencies closer to 50%, because they use the hot exhaust gases from the gas turbines to produce steam, which then goes through a steam turbine, adding to the total output of the power station. Southdown was a partial combined-cycle station, because some of the steam that could have been used to generate, supplied a nearby business.
At the time, domestic natural gas was plentiful and piped directly to these power stations. As mentioned in the second article in this series, prior to 2002 natural gas prices under the Maui contracts increased annually at half the rate of inflation, so gas was very cheap back then. But in 2002, the reserves in the Maui gas field were reassessed downward, which triggered a rise in gas prices starting in 2003 and continuing through to 2010.
Genesis Energy commissioned the fourth combined-cycle gas turbine in 2007, initially known as the Enhanced Energy Efficiency project (e3p) and now as Huntly unit 5, adding another 405 MW of thermal generation capacity.
In the early days of the market, combined-cycle gas turbines (CCGT) were an exciting new technology in NZ, providing more efficient generation than the traditional open-cycle turbines with lower emissions per kWh of output.
Gas could also fuel the steam turbine (known as Rankine) turbines at the Huntly power station south of Auckland, but with efficiency of around 35%, so it was more economical to burn gas in the new CCGTs. However, as the gas price rose after 2002 it eventually became cheaper to burn coal in the Rankine units, which lead to an increase in coal-fired generation from 2003.
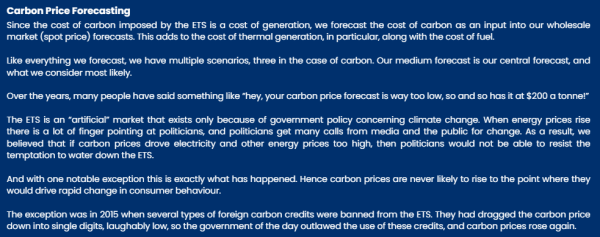
But leading up to the commencement of the Emissions Trading Scheme (ETS) in 2010, renewable generation technologies became preferred, starting with windfarms and geothermal power stations. As of today, the only one of the four combined-cycle gas turbines still in service is Huntly unit 5.
The ETS plays an indirect role in the wholesale electricity market, because it adds cost to any generation that emits greenhouse gases, with CO2 the main gas. Electricity generators do not have to be direct participants in the ETS, but all of the large generators are. At the end of each emissions year, 31st May, participants must surrender to the government carbon credits, known as NZ units (NZUs, not to be confused with sheep) in the ETS, in direct proportion to their emissions. For example, if a generator emits 100,000 tonnes of CO2 then it must surrender 100,000 NZUs.

Starting in the mid 2000s when the ETS legislation was in development, we observed a move away from fossil-fuelled new generation to renewable generation. It was as if the generators saw the writing on the wall and started the transition to more renewable generation well before the ETS commenced trading in July 2010.
In the third article in the series on demand, I showed that demand stopped growing after 2006. I also noted that it took years for everyone to come to terms with this fact and in the meantime, a considerable amount of new generation was committed and built on the assumption that demand growth would return at historical levels: this, as we saw in that article, has not yet happened.
Let’s suppose for a second that the cost of building new generation is falling rapidly, then new generation might be built even when demand is not growing, just to displace older, more costly generation. After 2006, the cost of building new generation such as windfarms and geothermal was falling, but not at a high rate, certainly not high enough to trigger a rush to build new generation in order to displace older, existing generation. In the absence of growth in demand, therefore, the rate at which new generation was built also slowed.
Fast forward to the late 2010s and 2020s, and expectations of demand growth started to rise in anticipation of the transition to EVs and electrification of industry. But on the 9th of July 2020, the Tiwai Pt aluminium smelter’s owner announced that it would the smelter close by August 2021, which they could do under the supply agreement they had at the time with Meridian Energy.
Tiwai ended up staying but, to cut a long story short, it wasn’t until May 2024 that the smelter’s owners finally inked new supply agreements with Meridian Energy, Contact Energy and Mercury NZ to keep the smelter operating over the long-term.
The smelter is a key player in the story of generation in the wholesale market because it is NZ’s largest electricity consumer by a ‘country mile’, consuming up to 13% of NZ’s electricity. If it were to close tomorrow, electricity prices would collapse, and not recover for several years, so no one would want to build new generation if closure was a possibility.
Because of this, it wasn’t until May 2024, when the future of the smelter was finally assured, that the current ‘stampede’ to build new generation started to build real momentum. Which brings us to the build process.
The second article in this series introduced the term ‘LCOE’ which stands for the levelised cost of electricity, which is always relative to a particular generator. For example, we might say the LCOE of solar generation is $100/MWh (10 c/kWh) by which we mean the total cost of building, operating and owning a solar generator over its lifetime is this value, including repayment of debt, and a return on the investors’ funds (equity) used along with the debt, to build the generation.
There is a lot more to the financial side of building new generation than the LCOE, but nevertheless it’s a handy figure which has a number of uses. One of these is when we compare the LCOE of a new generation project to the price it is forecast to receive for its output over its operating lifespan. For example, if the LCOE is $100/MWh and the forecast price over its lifetime is between $100/MWh and $105/MWh, this would suggest the project could be built and be profitable.
But if the forecast price is $90/MWh then maybe it’s better not to build it, or to find a way of reducing its LCOE through using cheaper solar panels, or accessing cheaper finance. Or waiting until prices rise to $100/MWh or higher.
The next chart appeared in the second article in this series, and it shows the real LCOEs, in 2025 dollars, of all projects actually built since 2009, using information in the public domain, e.g. there is usually a press release along the lines of “so and so has commissioned (or has committed to building) its new 150 MW Windstabberr windfarm at a total cost of $400 million and it is expected to power the equivalent of a zillion homes”.

You’ve probably seen them. I’ve never understood why there is so often a reference to powering a lot of homes - which homes are we talking about exactly? The homes that use lots of electricity? Or those that use hardly any? Will it power ours? And how do I get on the list for the power grab?
But I digress…
We take this information, along with some very educated estimates of other costs such as operating expenditure and finance, and calculate the relevant LCOE.
The chart shows LCOEs falling through to the end of 2019, after which they started rising again, initially due to additional costs associated with covid-19, but then to rising inflation.

If the LCOEs had stayed at their 2019 levels, we might have seen more new generation built early in the 2020s as the price of natural gas rose. Nevertheless, we are now seeing a lot of new generation being built, as shown in the chart at right (it appeared in the second article in this series but is now out of date as even more building is underway).
Right at this moment, generation is being built at the highest rate this century, while electricity demand growth has barely returned.
Ironically, after there was so much noise about the market not working in 2024 and through to today, the market has actually been flat-out building new generation. Which makes me think of that axiom from economics – “the cure for high prices is high prices”.
But if demand is not growing, then why is the rate of build so high?
I could get technical here and get into a discussion of the ‘financial engineering’ that might go into making a new generation project viable, because this can make quite a difference to a project that is marginal. There are other reasons why new generation is built, e.g. to play a role in a large portfolio of generation, or because the generator has managed to contract a buyer for all of the project’s output, and so on.
But to keep things simple, there is a global move away from fossil-fuelled generation to renewable generation, which is attracting vast amounts of capital globally, and NZ is perceived to be a good place to invest due to its political stability, stable market regulations, and ease of doing business. Hence there are many different parties looking to build new generation, not just the big gentailers.
This creates strong competition, a race to build if you will, and if you want to be a winner then you need to commit to building something before others do. If you don’t, you could end up at the end of a long queue, waiting for prices to recover.
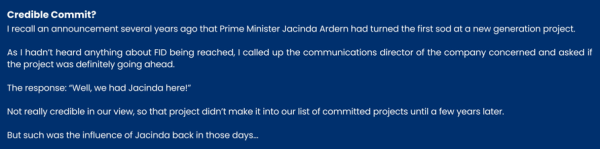
The strategy here is known as ‘credible commit’ where you signal to your competitors that you are going to build new generation, e.g. by announcing FID (Final Investment Decision), binding contracts with suppliers, construction crews on the ground, and so on.
Once this is done, competitors know they are one place further back in the race to build, which could delay their decision to build, for example.
The End of Big Hydro
The last ‘big hydro’ project completed in NZ was the Clyde dam, finally commissioned in 1992, four years before the wholesale market reforms began in earnest. Clyde has maximum output of about 390 MW, and required the flooding of 26 square kilometres of land including the old Cromwell town centre, the Cromwell Gorge, the lower reaches of the Kawerau River, and the Clutha Valley above Cromwell.
Nothing comparable in size has been built since and, given the abundance of hydro potential still left in NZ, we must ask the question; why not?
I believe it comes down to two key reasons, in no particular order: the cost of big hydro and the impact of big hydro on the natural environment, particularly large storage lakes.
Looking first at the environmental impacts, it is informative to go back in time to before the market commenced. Lake Hawea, a storage lake in the headwaters of the Clutha River, was raised 20 metres when it was commissioned in the late 1950s. My Dad and his parents holidayed at Hawea in the days before it was raised, and he often told me of the old shoreline and how different it was before the lake was raised. When I was a teenager, we holidayed in Wanaka over the summer holidays, and in 1976 the inflows into the southern hydro lakes remained low through into summer, so that Hawea emptied to the point where we were able to walk on the original pre-hydro shoreline.
We visited the Timaru Peninsula, which by then was normally submerged, and walked barefoot on the beaches of fine shingle that once lined the shore of the lake. Dotted across the peninsula were the black and silver remains of old trees, creating an eery atmosphere of decay and defeat, as if they’d been bombarded by artillery during World War I. Above the original shoreline sat 20 metres of new shoreline, consisting of poorly formed beaches, steep muddy banks, the remains of trees, and muddy flats that were once productive farm paddocks.
One day a strong northwester blew down the lake, and a cloud of dust filled the Lake Hawea valley, spreading down across the Hawea township, over the Hawea flats south of the township, and reportedly extending as far as Ranfurly 85 km to the southeast. The dust problem is so big that now the lake level is not consented to fall below a level about 8 metres above the original shoreline, to reduce dust storms and further erosion of the shoreline.
In the early days of hydro development, in 1926, Lake Monowai in the southwest of the South Island had its level raised by 2 metres, and the remains of the beech forest surrounding the lake remain exposed to this day. Other lakes, for example Lake Benmore in the Waitaki valley, which was filled in 1965, also have the remains of many hundreds of trees sitting just under the normal water level, forming a hazard for swimmers, boats and fisherman.
But things changed when the government of the day signed a deal with Comalco to supply a new aluminium smelter at Tiwai Pt near Bluff. The smelter was to be supplied by a new hydro scheme at Lakes Manapouri and Te Anau, which would raise the lake levels by up to 30 metres. Looking back on this plan from today’s standpoint, it seems like environmental vandalism on a grand scale.
But there was widespread opposition to the plan, including protests and marches. A petition presented to parliament in 1970 had almost 265,000 signatures. The plan was modified when the government changed in 1972, and today these lakes are managed within their natural levels, preserving their natural beauty, while retaining the generation potential of the Manapouri power station at West Arm which is one of the largest generators in the country.
What’s happened since the turn of the 20th century in NZ, is that tolerance of destruction of the natural environment has progressively reduced. Manapouri showed us that infrastructure can be added in a way which minimises the negative environmental impacts, but as a general rule I would say that anyone wanting to develop a large-scale hydro power scheme today, should expect push-back on a grand scale. People know this, which deters this type of big hydro project.
That said, there were two notable projects mooted by Meridian Energy which were both hydro-based and large-scale, but also came with a relatively low impact on the environment: Project Aqua and the North Bank Tunnel Project.
Project Aqua involved building a new canal down the lower Waitaki Valley, fed by water taken from the Waitaki River below Kurow, the site of the existing Waitaki dam. The project met a lot of opposition from environmental and other groups, faced complex geotechnical issues, and created uncertainty for Meridian over its right to use water in its existing power stations on the Waitaki River. The project was abandoned in 2004.
The company subsequently launched the North Bank tunnel concept which proposed to take water from Lake Waitaki, the small lake behind the Waitaki dam, and send it through a 34 km tunnel through a power station in the lower Waitaki Valley. Needless to say, the costs of such a tunnel would be enormous. This project also faced major geotechnical issues, was suspended in 2013, and then its resource consents expired in 2016.
In the meantime, the costs of wind, geothermal and solar power have all come down relative to big hydro, to the point where I believe the demise of Projects Aqua and North Bank tunnel signalled the end of the era of big hydro.
With one possible exception – the Lake Onslow pumped hydro scheme in Central Otago. I won’t comment on this here, but will cover it in the final article in this series.
Looking Ahead
So where to now?
Will the current rate of build continue and, if so, for how long?
In the longer term, what happens from here depends primarily on three things. First, how much demand grows: in the long-run, more demand requires more generation, and vice versa. It doesn’t get much simpler than that.
Second, perceptions. Even if demand doesn’t grow, it could take years for developers to come to terms with this and stop building new generation. There is a precedent for this in the years after demand stopped growing in 2006, through to 2014.
Third, what happens to the cost of new generation, i.e. if the cost of building, operating and owning new generation (LCOEs) rises or falls. In a world where the LCOE of new generation keeps falling, all existing generation would be in danger of eventually becoming uneconomic, and could be decommissioned. Ultimately, new generation could replace all existing generation, up until its total output equals total demand plus losses.
Conversely, if LCOEs were to continue climbing at an ever-higher rate, then developers would delay building until prices rose to justify investment, and the rate of build would slow.
As explained at some length in the third article in this series, there is a high degree of uncertainty in how much demand will grow, and when it will grow. Right now, there is a good chance that a combination of more EVs and electrification of industry will keep demand growing, with large data centres also on the horizon. As demand starts to rise, this will give developers confidence to continue investing in new generation, repeatedly playing the credible commit game, so that generation could be built ahead of new demand for years to come, helping to keep the lid on electricity prices. This is a possibility we should not ignore.
LCOEs of renewable generation were falling prior to 2020, but given the current geopolitical uncertainty, inflation is likely to remain high for years to come. Exactly how many years is harder to tell. That being the case, we should not expect large falls in LCOEs. The most favourable outcome in my view would be for LCOEs of some technologies to fall in real terms, albeit at a low rate.
If demand does not grow, and the build-out continues, then eventually prices will be so soft that even the most optimistic developers will have to admit ‘defeat’.
But it might be that on top of electrification of transport and industry, we also get a hyper-scale data centre or two built in NZ, pushing demand growth to the pre-2006 levels of 700 GWh per annum, perhaps more. In this scenario, the current rate of build might be sustained for several years yet.

Firming
My final comment on where generation goes from here concerns the future of thermal generation, including gas, coal and diesel-fired plant. For many decades, some of NZ’s thermal fleet operated in baseload mode, which is to say it ran at constant output 24x7 for weeks or months on end. But with the rise in renewables, the thermal fleet now operates in firming or peaking modes.
A peaking plant operates for periods of hours or days when demand is particularly high, or other plant is unavailable.
A firming plant operates for weeks or months, but varying its output during the day as demand rises and falls, or other generation is or is not available. In NZ, the role of firming plant is critically important because it fills the gap during dry periods when hydro lake levels are falling due to lower-than-average hydro inflows. History shows that dry periods can last several months.
Earlier this year the government issued a consultation paper on a proposal for a new reliability obligation for managing dry periods, which to be frank I found puzzling because it would place additional obligations on large electricity users to contract for additional generation to cover dry periods, and also relies on forecasting demand a few years ahead which, as by now I have pointed out a few times, is difficult at the best of times.
As I write this, the Electricity Authority has also just issued a consultation paper on options for improving incentives for market participants to provide firming for dry periods.
The dramatic (one might say drastic) fall in gas reserves and production suggests that electricity generators will shy away from using gas in future. But if a future government goes ahead and builds an LNG terminal, that could make gas viable as a fuel for years to come. Such a terminal would allow liquified natural gas, predominantly methane, to be shipped to NZ where it would be regassified and injected into the gas transmission pipelines in the North Island, from where it can supply thermal generators and other gas users.
We must never forget the potential for ‘black swan’ events to happen, even when we are close to 100% renewable electricity, so it will always be important to have alternatives that we can fall back on when needed to keep the lights on, the heat pumps running, the cars and trucks rolling, and the wheels of commerce and industry turning.
Because of this, if it can be achieved, having a mix of ‘old-style’ technologies around in case of emergency is still a great idea. As I’ve already said in the second article in this series, as we race headlong to 95% renewable electricity, in terms of bang for buck, the greatest reductions in emissions come from electrifying transport and industry, not from removing the last tonne of emissions from electricity supply.
The next article in this series will be on the electricity hedge market, and the final article will look at the question of how we keep electricity prices low into the future.