30 Years of the Wholesale Market: How Has it Performed?
Download ReportBy Greg Sise, 15th September, 2026
Energy Trendz Perspective - Issue 9
Our Executive Chairman, Greg Sise, looks back over 30 years of the wholesale market, in the second of a series of perspectives on the market.
2026 is a milestone year for both the wholesale electricity market and Energy Link. On 2 September, Energy Link celebrated 30 years in business, and on 1 October, the New Zealand electricity market will mark its own 30th anniversary.
This is the second in a series of articles that are a mix of perspectives on the market, focussing on key elements such as demand and generation, and also on Energy Link, the role that we’ve played, and how this has changed.
The first article looked at why we have a competitive market, starting with moves to reform the electricity sector in the late 1980s, through to the start of the spot market in October 1996.
This article looks at how the market has performed relative to expectations. Initially, I intended to include my thoughts on where the market might go from here in this article, including what measures could bring electricity prices down for consumers, but this article is also quite long, and that would make it even longer. So, instead, that topic will form the last article in this series.
Market performance is a topic which gets a lot of press from time-to-time and a lot of attention from politicians of all stripes, so it can be controversial. But it’s been my job to think about the market for the last 30 years, and I am not one to shrink from giving my views.
There is plenty in this article for those already familiar with the market, but I have tried to keep the complexity down so that any reader willing to spend the time to read it and to exercise some neurons, should gain something from it.
So here we go.
In the first article we saw that the Wholesale Market Development Group (WEMDG), which delivered its final report in August 1994, recommended that a new market should:
- deliver electricity at the lowest possible cost to the economy;
- move away from the taxpayer having to underwrite all investment in electricity generation, attracting a much wider range of sources of capital;
- move away from the price freeze-price hike cycle;
- incentivise participation by independent power producers (IPPs).
Participation
It is remarkable just how much current interest there is in building new generation and battery energy storage systems (BESS) in NZ, spread across a wide range of parties from all around the world. For the projects to be completed this year alone, taken from Transpower’s ‘connection queue’, there are 19 different developers listed, many more than the four large gentailers that were split out of ECNZ (Contact Energy, Genesis Energy, Mercury NZ and Meridian Energy) and who have dominated this space for the last three decades.

The connection queue also shows a total of 18,593 MW of generation and 7,522 MW of BESS in various stages of development, including concept development, for delivery in 2027 and beyond.
This was not always the case, however. Prior to 2019 there were only ever a handful of projects in the connection queue, and it is only since then that the interest in building new generation has risen to these stratospheric levels. Taken at face value, this suggests the market does indeed support a wider range of sources of investment capital and competition from IPPs.
At this point I should note that demand has not grown by much, if at all, since around 2006 (more on this in a future article), so there was no great need for new generation over the last 20 years, but now virtually everyone expects demand to grow substantially over the next two decades as the economy electrifies.
Participation by Government and IPPs
The increase in the number of participants in the generation side of the market since 2019 is truly impressive, and I am sure that the WEMDG members would be suitably pleased with this number. So, a big tick here.
But why did it take so long to reach this amount of participation?
As already mentioned, demand growth stalled after 2006, which is not conducive to encouraging a lot of new generation to enter the market. Furthermore, the Tiwai Pt aluminium smelter, which consumes 12-13% of NZ’s entire supply of electricity, went through a period where it looked likely to close, and if this amount of demand disappeared from the market overnight, prices would fall precipitously and take years to recover. Not a prospect that a potential generation developer would cherish.
But the future of Tiwai is now secured well into the 2030s, and expectations of demand growth are high, so interest in building new generation has grown.
But this still doesn’t entirely explain why the interest is so damn high: in October 2023 there were no grid-scale solar farms (over 10 MW maximum output capacity¹) in NZ, but we now have thirteen, and there are more on the way this year and next. I think there are other factors at play, including the global transition to renewable electricity, now in full swing, driven in large part by falls in the cost of renewables, especially solar power and the BESS that will increasingly be paired with solar farms.
NZ is also seen as a stable, attractive place to invest, and post-covid advances in video conferencing technology have made it easier to investigate NZ from afar. In our case, we often have offshore clients that we never meet in person, but provide forecasts and other services to help them to evaluate and capture opportunities to enter the NZ market.
At the same time, although the government initially owned the three SOEs gentailers, which are now listed companies in which the government has a 51% share, the government has not had to stump up any cash to help invest in building new generation or otherwise keeping the lights on.
Notice the use of the words “had to” because the government did actually stump up $150 million in 2004 to rebuild the Whirinaki diesel-fired power station to have it available for dry years, which is ironic because Contact Energy, who owns the station, had just finished decommissioning it because it was hardly ever used. But this is a good example of why it’s not great when government gets directly involved in making decisions on when to invest in new generation, and how much.
Also in 2004, the government agreed to underwrite the gas supply for Genesis’ new 405 MW combined-cycle gas turbine generator at the Huntly Power Station, finally commissioned in 2007.
Earlier this year, the government also paid $198 million to retain its 51% share in Genesis. Energy when the company went to market to raise capital through an equity issue. But again, this was optional and the government could have let its share fall below 50%.
There is also an on-going cost in maintaining the regulatory functions that govern and monitor the electricity market, primarily the Electricity Authority.
But overall, I think it reasonable to conclude that the market is achieving these two key objectives – reducing the investment burden and risk for the taxpayer and incentivising the entry of IPPs.
1. Most grid-scale solar farms connect to the wider grid in local networks, not directly to the Transpower grid.
Price Freeze-Price Hike Cycle
In the first article I noted that in a two-year period, 1976-77, the wholesale tariff increased 124% as the Minister of Energy acted to ensure that electricity was not sold at a large loss.

As the chart above shows, there was a price hike in residential prices (including GST) between 1975 and 1979, which saw the price rise by 51%, clearly the result of the meteoric rise in the wholesale rate.
Of course, consumers don’t pay real prices, they pay nominal prices. So even if the real price is constant or falling, the nominal price can still be rising, with consumers paying more for their electricity in raw dollars.
But we use real prices because it helps to put electricity prices in context. For example, if the nominal price of electricity rose by 1% per annum year after year, but the general cost of living rose by 3% year after year, after several years electricity would “feel like" it is cheaper relative to other items that go into calculating the CPI.
After 1979, prices actually fell by 21% before continuing the climb from 1984 to two years into the market in 1998.
From here, they fell by 7% through to 2001, before rising again by 56% to hit their peak in 2015.
The highest rate of annual increase since the market started in 1996 was 3.2% per annum from 2001 to 2015, compared to 50% per annum pre-market, from 1976 to 1977.
Now, as we’ll see, the residential price is the sum of the lines and the energy components of the price, and the lines component was also increasing from 2001 to 2015, so the increase due to rising wholesale prices, along with the costs of retailing electricity, was less than 3% per annum in real terms.
What I take from this is that the wholesale market has contributed to significant real price increases in residential electricity, but at a much steadier pace than had occurred prior to the market opening in 1996.

I think we can conclude that the market has moved away from the price freeze-price hike cycle, at least for residential consumers.
However, the same cannot be said for large electricity consumers, including industry and large commercial businesses. These consumers contract for electrical energy on average about every 3 years, by going to market for fixed electricity pricing for terms of anywhere between one year and five or more years.
The chart above shows the real contract index maintained by Energy Link from 2009, and NZX before that. This excludes line charges and GST.
There was a substantial increase of 136% between 2000 and 2004, an annualised increase of 8% per annum, and more recently an annualised increase of 15% per annum.
So, the large consumers have not feared as well as residential consumers, although these rates of change in price are still lower than the worst of the pre-market days.
This is a characteristic of electricity price changes for larger consumers who play in the contracts market: they see swings in prices which mirror changes in the wholesale price of electricity. But residential consumers, along with smaller business consumers, see price changes which lag changes in wholesale prices. There are several reasons for this.
First, the wholesale price is only one component of the all-up electricity price.
Second, the residential and small business consumers tend to make up a steady percentage of a gentailer or retailer’s customer base, so the load they represent can be hedged well in advance, thus smoothing out price increases. Taking on a new large consumer is typically hedged by retailers at the time at prevailing rates, linked to the wholesale market, which are passed through to these consumers.
Finally, imagine the fuss that would ensue if residential consumers saw price rises of 15% and more per year. The politicians and pundits would have a field day!
Hence, residential price increases lag wholesale price increases. By the same token, they also tend to lag wholesale price decreases.
Taken overall, price freezes and price hikes have reduced in size since 1996, but they are still there for larger consumers.
But why did the wholesale price increase so much after 2018? Was it because wholesale costs changed? I cover this in the next section.
Cost of Electricity
I now want to turn to the issue of the price of electricity, and how having a market has contributed to increases or decreases in the price of electricity paid by consumers. In particular, looking at whether the market has delivered electricity at the lowest possible cost to the economy?
In this section, I cover what I see as the key issues:
- the role of the gas market in causing electricity prices to rise;
-
the rising cost of, well, everything;
-
the role of the hedge market in setting the cost of electricity;
-
keeping the lights on versus keeping prices low.

The first chart above shows the real price (in 2024 c/kWh) of electricity delivered to residential, commercial (small and medium businesses, government departments and local authorities) and industrial (large) consumers, using the latest official annual data published by MBIE. Residential prices include GST whereas industrial and commercial prices do not.
The industrial prices are also the average across all consumers, whereas the contract index shown earlier in this article is made up of the prices of new contracts, and hence reflective of the marginal price of contracted electricity.
Also on the chart, to provide some context, is the real price of regular petrol (what we call 91 today) including GST, which has risen 53% since the market started in 1996.
Conventional wisdom is that commercial prices were on the way down in the 1980s and 1990s as residential prices rose, as cross-subsidies between the two sectors were progressively removed. This appears to have continued through to 2001.
After the market started in 1996, all three categories fell through to 2000-2001, after which all three rose. Residential prices continued to rise until 2014 but then fell through to 2022-23, then rose in 2024.
We can break the real residential price down to energy and line charges, using data from MBIE, which has a series of real prices back to 2006. These are shown in the next chart.
Over this period the lines charge increased by 12.9% and the energy charge by 13.7%, so the two contributed in roughly equal proportions to the overall increase.
These are grand averages across NZ, but when we look at different locations the total and the two components can be significantly different due to electrical losses on the grid, whether a local network area (lines) is predominantly rural or urban, with rural consumers tending to have higher line charges because there are less consumers per line in these areas, and consumers in areas with higher demand and less generation having higher energy charges due to the losses incurred on the grid as electricity is transported from generators to consumers.

The energy charge is the sum of the wholesale price of energy, the cost of retailing energy (including metering, invoicing, customer services and marketing, risk management, administration), and GST.
The wholesale price of energy is what the market delivered. We could use spot prices for this analysis, but these are highly volatile and, in reality, electricity retailers use a variety of methods to hedge the spot price of electricity, as noted above.
When they hedge, they are really just locking in a longer-term price for electricity based on expectations of future spot prices. As we don’t know what spot prices will be, these expectations are based on an average over the likely possibilities, reflected in the price of the hedge contract, i.e. the hedge price averages over possible future spot price trajectories. The hedged wholesale price is the largest component of the increase in the energy charge.

The index of contract prices, already mentioned twice in this article, is shown in the next chart alongside the real wholesale price of natural gas in the North Is, with the latter including the cost of carbon². The correlation between the two curves is 0.93, which is very high.
The correlation between the two curves is no accident, because gas is used for generation from fossil-fuelled ‘thermal’ generators. These generators are often price-setting (we say they are marginal), so the price of gas is a direct contributor to the average price in the chart.
But gas also has an indirect impact on prices because it is a key driver of the value of water stored in our hydro lakes. Hydro electricity makes up about 55% of supply on average, so anything that impacts its value also impacts the price of electricity. The value of water in storage is a key determinant of the prices that hydro generators offer into the market.
The reason for the indirect role of gas in the value of water is not obvious, unless you happen to be an economist.
The major hydro generators don’t pay anything for water as it enters their respective hydro lakes, so their variable costs are almost zero. But if they offered all their generation into the market for nothing, then hydro would run flat-out, the lakes would empty out and we would have shortages³.
Therefore, the value of water stored in hydro lakes is calculated in a way which balances the generation from the hydro lakes, with generation from thermal generators, the latter being primarily fueled with natural gas.
For example, if hydro generation is offered above the price of gas-fired generation then the lakes will fill up and there will be excessive spill (water that goes down the spillway and not used for generation) and more thermal generation than necessary. If the hydro is offered below the price of gas-fired generation then the lakes will empty out and there will be a shortage of electricity.
Hence the hydro offer prices, and the value of water stored in the hydro lakes, is heavily influenced by gas prices, and this indirect effect combines with the direct price-setting effect when gas-fired generation is on the margin, which leads to the correlation seen in the chart.
What I have just laid out is why there is not just correlation, but also causation. Put another way, where the gas price goes, there goes the electricity price.
When the market started in 1996, the wholesale price of gas was set by the Maui contracts, under which the gas price increased at half the rate of inflation: seems ridiculous, but that’s how it worked. In 1996 the gas price was just over 1 c/kWh.
2. Since the Emissions Trading Scheme was introduced in 2010, the all-up fuel cost includes the cost of the fuel plus the cost of carbon emissions from the fuel when it is combusted, which is in turn the emissions per unit of fuel multiplied by the carbon price.
3. It’s more complicated than that, but I want to focus on the key points.
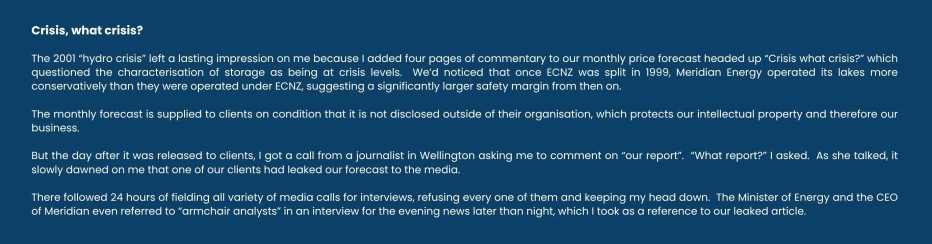
But then two events happened in 2001 and 2002, respectively. First, there was the “hydro crisis” of 2001 in which the hydro storage lakes got very low going into winter and spot prices spiked to record levels, causing quite a stir.
Getting back to the market, there was a sharp increase in the price of electricity contracts after the 2001 hydro 'crisis', which can be seen in the last chart above, as electricity retailers recalculated the price of electricity to include future crises. As it was, there were more crises in 2003, 2005/06 and 2008, as we went through a multi-year period of lower-than-average inflows into the main hydro lakes.
Then in 2002 there was a reassessment of the remaining natural gas reserves in the giant Maui field offshore from Taranaki, which came out with reserves less than the original estimate. This led to renegotiation of Maui gas contracts with Contact Energy, Methanex and Vector for the remaining gas, which remained at the Maui price, but then they had to secure additional gas at higher prices, leading to a reset of natural gas prices as the price of new gas rose to the actual cost of production.
The gas price reset is not that obvious from the chart as gas contracts tended to be long-term in those days, and the gas curve is the average price across all wholesale gas contracts. Methanol producer Methanex on its own accounted for almost half of gas consumption, and it prefers long-term contracts, which it probably gets cheaper than other consumers due to its size.
The electricity index, on the other hand, reflects only the price of new contracts, which were then priced based on the new price of gas. Hence, we see a gap between the two curves which finally closes in 2018.
Nevertheless, we can see that the price of natural gas is a big driver of electricity contract prices. If gas prices had remained roughly constant since 2018, then the wholesale price of electricity, as expressed in contract prices, would be about 8.4 c/kWh lower (in real terms) than it was in 2024, the last year of the chart, if all other things were held equal. That is a big number!
2018 was a bad year for gas, due to an extended problem with supply from the offshore Pohokura platform. As it turned out, this was a harbinger of issues to come, because since then we’ve seen gas reserves plummet dramatically, to the point where Methanex is to cease operations in 2027, the market is moving away from using gas at a greater rate than ever, and many smaller gas users are looking to switch to using electricity or other fuels.
At this point, you might think that I am excusing the electricity sector from taking the blame for electricity price increases, instead passing the blame to the gas sector. You would be partly correct in thinking this. The electricity sector, and most of us working in and around the sector, were lulled into a false sense of security over gas supplies.
To the best of my knowledge, participants in the gas sector were also surprised at how quickly gas production and reserves have fallen, especially in the last two years. But you do wonder when the annual reported gas reserves, which are supposed to reflect the median reserves in each gas field fell 17% in 2023, then 21% in 2024, 28% in 2025 and 22% this year. I’m no statistician, but it is pretty obvious that if these are truly median values, the probability of falls of this magnitude four years in a row is very low. Which really makes me wonder what was going on when these reserves were calculated. Just saying….
It’s been a major source of frustration to me, to Energy Link, and to many others in the electricity sector that the gas market, which is larger and more concentrated than the electricity market, is so lightly regulated relative to the electricity market. This is one of those points where I start thinking “If I were the Minister of Energy …” I’m sure you get my drift.
In my view, the reliance on the lightly regulated gas market to provide fuel for thermal generation was a flaw in the design of the electricity market, and what should have happened is that the electricity and gas markets would come under one regulator with the power to set rules in both markets, to promote competition, ensure transparency and to take actions when information disclosure and market behaviour failed to meet the required standards.
The electricity regulator has the power to make and enforce the rules, but the gas market operates on a “co-regulatory” model which combines legislation with industry self-regulation. This has resulted in a lack of transparency, as we need up-to-date information about gas supply and price, which was always hard to find.
But over the last two years, it’s become very clear that the electricity generators, and the market as a whole, can no longer rely on gas as a backup for dry years. If the government goes ahead with an LNG terminal this will help the situation, but this is as much about providing gas to other consumers as it about providing gas to the electricity sector, because many gas-consuming businesses could have technical and other problems switching away from gas.
On a more positive note, electricity will become even less reliant on gas, and the influence of gas on electricity price expectations will reduce as a consequence.
Getting back to how the market had performed relative to WEMDG’s objectives, in my view, the question we really have to answer is: given the reliance on the gas market, has the electricity market delivered the lowest possible prices to consumers?
If we accept that gas is a major driver of wholesale electricity prices, then the chart shows that wholesale contract electricity prices have not risen more than can be explained by gas prices. To put it another way, prices would only be lower if reliance on gas had reduced further and faster than it has: should it have done?
With perfect foresight, it is obvious that generators would have started the move away from gas sooner than they did, which would have helped to keep prices lower than they are today. But foresight is not perfect, and the market has reacted as the problems became progressively more obvious. One factor that is relevant here is that electricity generation tends to get priority over other uses of gas, for example in the way that Methanex reduced its operations so that it could sell gas to Contact and Genesis, which means that gas has always been available.
But even then, should rising prices since 2018 have attracted more competition in generation, or caused the gentailers to build more generation, helping to stop the rise in prices caused by the gas supply rundown?
A confounding factor here is the uncertainty over the future of the Tiwai Pt smelter, mentioned above, which caused the risk associated with building new generation to be higher than normal. That was finally resolved in May 2024 with the announcement of long-term contracts between the smelter and gentailers Meridan Energy, Contact Energy and Mercury NZ.
And it is only since 2019 that many more potential competitors have entered the market in NZ. It takes time to develop new generation projects to the point where they can be built. A developer needs a suitable site at the right price, along with an agreement to lease or buy the land, then they need to get the relevant consents and undertake consultation with affected parties, they need funders which are a mix of investors and financers (the latter provide money in the form of loans), and they need their project to be financially viable.
The next chart shows the “LCOE” of projects actually built since 2009, including all projects for which there is data in the public domain. LCOE stands for Levelised Cost of Electricity, and it is a single number which expresses the total cost of building, owning and operating a power station over its lifetime, including financing costs (payment of interest on loans, repayment of loans, and a return to investors), relative to its output. In simple terms, if a generation project expects to receive prices for its output that equal or exceed its LCOE over its lifetime, then the developer should build it.

The LCOE is highly significant, because as prices rise due to rising demand or, as we’ve seen, rising gas prices, then price expectations could rise above LCOEs and we should then see more generation being built. Ultimately, there could be enough new generation built to displace expensive gas-fired thermal generation, and to pull wholesale electricity prices down.
An interesting thing happened over the covid years. Governments around the world provided large amounts of money to keep their economies going (fiscal stimulus), monetary policies were relaxed (interest rates fell) and supply chains faltered, which led to inflation on a scale not seen for decades.
We use historical and estimated LCOEs in our forecasts to predict when new generation will be built. Prior to covid making its appearance early in 2019, LCOEs were falling as solar panels and wind turbines became cheaper. But starting with covid, we observed that developers were having trouble sourcing the parts they needed for their projects. Lead times on the power electronics used in solar farms, for example, went from six weeks to almost a year.
Prices started to rise as a result of the delays, and we were updating our LCOE estimates on an almost weekly basis. Then inflation hit, making the situation even worse.

Developers need to know their costs so they can take their projects to their investors and financers for approval. But when prices are rising rapidly, this process is interrupted, often many times, by re-pricings, causing delays in getting projects approved and construction underway.
At our end, we had to work hard to ensure that our long-term price forecasts were keeping up with the trends in LCOEs, but there was a period where every time we released a forecast it became out of date soon after.
Inflation has now slowed and there is an impressive amount of new generation being built, as shown in the chart above.
It has the total cumulative output of all the new generation represented in the LCOE chart, which is now over 9,000 GWh per annum, or 21% of existing annual generation output. And there is lots more in the pipeline.
There will be a whole article devoted to the electricity hedge market, so I don’t want to get into the details here, but one of the barriers faced by IPPs and independent retailers that want to enter in our market and to grow, is access to hedges at a competitive price.
Gentailers have generation and customers, which provides them with a high degree of ‘natural hedging’. But an IPP has a big exposure to spot prices for generation, and an independent retailer has a big exposure to spot prices when it buys from the spot market to supply its customers. As a result, both would like contracts that hedge these exposures.
For a variety of reasons, the hedges they need have not been easy to obtain at a price which allows them to thrive and grow, which has put many of them off. When these players do succeed in the market, they have proven to be both competitive and innovative. For example, I find it hard to think of any new offerings to residential consumers that wasn’t introduced by an independent retailer: Electric Kiwi’s free hour of power, Flick Electric’s spot price plans, Energy Club’s club fee, to name a few.
We are now seeing a lot of IPPs in the market, and recent changes to the hedge market may incentivise new independent retailers to join the market. We will see…
Getting lower electricity prices for consumers is actually quite simple: if there is a squeeze on electricity supply, just don’t supply. I had dinner by candlelight during blackouts in the 1970s when the hydro lakes got very low, today’s youngsters just need to toughen up. Consumers can do with a few cold showers on the coldest winter days. If your EV can’t charge overnight just take the bus. Simple, right? Right? To keep prices down?
Wrong!
Electricity generators read the news, listen to radio and watch TV, monitor social media, and they get many other signals. Keeping prices down is one of these. But the strongest signal, by far, is the imperative to keep the lights on. Transpower has a key role in monitoring lake levels and the margin between generation and demand in real-time, and raises the alarm when the margin falls too low. But when supply is actually interrupted, all hell breaks loose. The politicians, media and public all get on board, there are inquiries, reports and calls for heads to roll.
We the voters, should not be surprised that then, the market takes security of supply more seriously than anything else, including the price of electricity. But if all other things are equal, making supply more secure comes at a higher cost.
Has supply become more secure since the market opened in 1996?
Whenever we have a dry period with falling lake levels and rising spot prices, the clamour starts. In 2024 I remember hearing someone from Tekapo quoted as saying something like “I’ve never seen the lake so low!”. Fair enough, they probably hadn’t seen the lake so low but in reality, it was lower many times in the past.
The last time we were seriously in danger of the lakes hitting bottom was actually in 1992, four years before the market started, when ECNZ (mentioned in the first article in this series) managed most of the generation in NZ. Storage in the South Is fell to under 500 GWh (500 million kWh), which today would be almost unthinkable, and consumers were asked to reduce electricity consumption by 10%. The underlying reason for the shortage was the “1-in-20” standard to which the lakes were operated, meaning that there should be no more than one year in 20 when shortages would occur. Or put another way, it’s OK to have a shortage one year in 20.
A post-shortage review recommended the standard be increased to 1-in-60, which carried over into the market in 1996. Energy Link monitored storage levels on at least a weekly basis, and still does to this day, and when ECNZ was split into three SOEs in April 1998, I immediately noticed that Meridian Energy operated the main two storage lakes, Pukaki and Tekapo, more conservatively.
This was not mandated in any way, but I think what happened was that the split of ECNZ removed the ability of Meridian, and the other new SOEs, to manage their hydro risk by running thermal generation. Instead, if they could not generate enough from hydro to supply their customers, they would have to buy from the spot market at prices set by other gentailers’ thermal plant, and this posed a huge financial risk. One way to mitigate this risk was to operate the lakes more conservatively by holding them higher in summer and increasing the value of water earlier in a dry period, holding storage higher into and during winter. From the 2010s Meridian Energy also purchased hedge cover from other gentailers, and now also has the ability to call demand reductions at its largest customer, the Tiwai Pt smelter.
I think we can be very sure that one key result of splitting ECNZ, which was done primarily to increase competition, was to deliver greater security of supply. But has the higher level of security come at a higher cost?
It should be obvious that the answer to this question is yes, and the real question is how much higher?
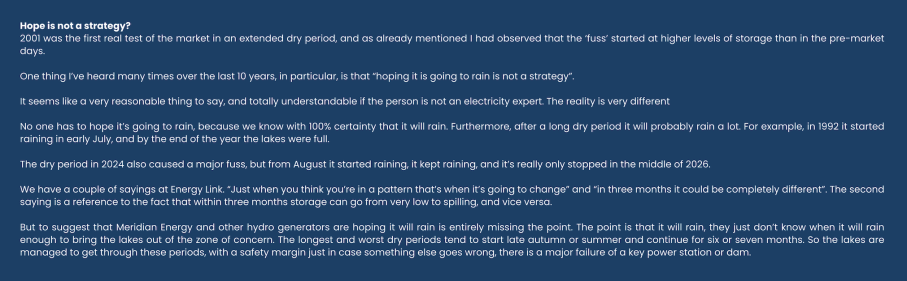
In our July 2026 long-term forecast, we included an Outside the Box scenario which modelled the effect on storage and the market of Meridian having consent (which it received just after the forecast was released) to routinely operate Lake Pukaki into its “contingent storage” zone which was only available in emergencies. The impact is to reduce spill from the hydro lakes, increases prices in summer and lower them in winter, with the annual impact on price being a reduction of a few percent.
However, because most consumers use more electricity in winter, the reduction in the average price paid would be closer to 10%.
So, we probably do pay more for the higher level of security we enjoy with the market, but given that a very high value is placed on having secure supply, the thing I find the most surprising is that the ‘dry year security premium’ is not higher. It is also much less than the impact of the gas market on electricity prices.
Emissions
Finally, we come to the question of emissions and how the market performed in finding a solution to the problem of emissions.
When I say ‘solution’ I mean a solution to the problem of getting to electricity generation that gives 100% renewable electricity (%RE). Whenever this topic comes up, I like to compare it to a quote attributed to Nobel laurate physicist Richard Feynman, who famously said something along the lines of “if you think you understand quantum mechanics, you don't understand quantum mechanics”. In the context of electricity, my paraphrasing of this is “if you think you know how NZ gets to 100% renewable electricity, you don't understand the difficulty of getting to 100% renewable electricity.”
I often get pushback on this play on physics, and people will say you just build Lake Onslow PHES system, or ‘over-build’ renewables, or whatever. The problem is, though, that it’s relatively easy to see how to achieve 100% RE from the technical perspective, e.g. by massively over-building renewables, but none of the 100%RE alternatives are currently economically feasible.
The term over-build refers to building more renewable generation than the market will deliver on its own. In the absence of any massive storage or thermal generation, an over-build would be required so that all the gaps between supply and demand are filled. But building this amount of generation would depress spot prices to the point that no one would build new generation in this environment because it would not be a good investment.
There are objections to this line of reasoning, primarily that adding storage would solve the issue by reducing the need for an over-build. All well and good, but adding large amounts of storage in the form of grid-scale battery energy storage systems (BESS), for example, would also have the impact of reducing prices, or more particularly the difference between the highs and the lows, which would again limit the attraction of building enough BESS to ensure 100%RE.
What about Lake Onslow PHES? I intend to write a separate blog on this potential project and go into a lot more detail, but to keep it short, this project would likely also suffer from the problem of being economically infeasible due its high cost, and to the way that hydro storage facilities like hydro storage lakes put a value on their water.
Back in 2019, the Interim Climate Change Committee, the precursor to the Climate Change Commission, took the view that the most practicable way of reducing emissions across electricity, transport and industry would be to move towards 95%RE while at the same time electrifying the transport fleet, starting with cars and vans, and electrifying industry by using electricity for process heat. As electricity moves closer to 100%RE, the biggest marginal emission reductions can be made by switching transport and industry away from using fossil fuels, not by achieving the next 1% of emission reductions in electricity generation.
I’ve found that a lot of people just don’t get this and instead they see coal and gas being burned for electricity generation during peaks and dry years especially in winter, and they want to see that stop. But I see this view as being a case of “the perfect being the enemy of the good” in which focussing on getting to 100%RE distracts NZ from the much bigger gains to be made by electrifying transport and industry.
So how have we done emissions-wise? The chart below shows the generation mix going right back to 1996. The %RE varies each year depending on whether hydro inflows were more less than average, but it averaged in the mid to high 70% range in 1996, then it fell to 66% as more gas-fired generation was built to meet increasing demand, then since 2009 (when the government formally proposed a carbon tax) it moved steadily upwards and today is around 90%RE.

Reducing emissions was not part of the WEMDG brief, but nevertheless we can see that the market has increased the %RE overall and the trend is still upward. What is perhaps even more important in this context is that the market responded in the right direction when a carbon tax was proposed.
Conclusion
We’ve seen that for the most part, the market has achieved what WEMDG expected it to. It has eliminated price freezes and reduced the magnitude of price hikes, it has vastly reduced the need for the government to invest in new generation, and we see now how attractive it is to invest in the NZ market now that expectations of demand growth are high.
The market has also delivered greater security of supply in dry periods, and steadily reduced emissions since NZ started its journey to reduce emissions as a whole.
But has it delivered electricity at the lowest possible cost to the economy?
I think we can say that it is successful in delivering electricity at a price reflective of cost, but the WEMDG design assumed that gas would be readily available at a reasonable price. To be fair to WEMDG, I don’t believe its terms of reference extended beyond electricity. But in hindsight, including the gas market in the same set of reforms, bringing it into the same governance as electricity, would have increased the level of oversight, increased information disclosure and transparency, and might have led to an earlier realisation that gas reserves were under threat.
The 2018 ban on new offshore oil and gas exploration permits often gets a lot of bad press when it comes to the run-down in gas reserves. I am not getting involved in that debate, but I do believe that things might have gone differently had the electricity and gas markets been regulated under one, highly co-ordinated regulatory structure.
Despite a lot of attention being paid to the electricity futures market (more on this in the article on the hedge market), the wider hedge market received little attention until quite recently, which made it harder for new entrants and smaller players, reducing competition and innovation. WEMDG devoted a lot of its work to the issue of incentivising IPPs, but as far as I can tell, didn’t consider the entry of new independent retailers, so its reforms can’t be judged on the difficulties experienced in the retail sector of the market.
The next two articles will cover demand and then generation, and then there will be one on the hedge market. The final article will look at the vexing issue of what would bring electricity prices down or at least stop them rising in real terms.